Cloudwatch monitoring for Lambda functions
If you are reading this you are probably running, or plan to run, applications in a production environment. Observability over how your applications are performing is critical if you want to deliver a successful product. As with all things in life problems happen, and when problems happen you will need to answer two questions: what’s broken and why?
I encourage you to invest some time into building sufficient monitoring, alerts and logging into your applications, so you can answer the two questions above as quickly as possible to get your applications back to a stable state for your users.
There are four golden signals of monitoring.
- Latency - The time it takes to process a request. We want our systems to meet their SLAs and slow latencies can be a symptom of a larger issue. We should care about all latencies, even those of failed requests.
- Traffic - This measures how much demand is on your service. In terms of an AWS Lambda function it would be the number of invocations. If you were monitoring a HTTP service it would be the amount of requests.
- Errors - These can be errors that fail explicitly (a 500 HTTP status code), implicitly (a 200 HTTP status code but the data was wrong) or by policy (we have an SLA of 500ms, so a request of 1s should be considered as an error).
- Saturation - How much capacity are we using? Would we be able to scale to process double the requests? These metrics could be memory usage, IO or CPU.
The purpose of this post is to give an introduction to monitoring Lambda functions in AWS. We will be going step-by-step through:
- Setting up a monitoring dashboard in Cloudwatch
- Creating some widgets with Lambda functions default metrics
- Adding custom metrics to a Lambda function
- Creating widgets on your dashboard to display your custom metrics
The technology we will be using is:
- Python for the Lambda function
- Boto3 to send custom metric from the Lambda function
- AWS Cloudwatch
You can find code examples here https://github.com/the-bearded-developer/lambda-cloudwatch-metrics if you want to follow along and do some experimenting of your own.
Step 1 - Create a monitoring dashboard
- Log into the AWS Console and navigate to Cloudwatch
- Click on “Dashboards” in the menu on the left
- Click the create dashboard button
- Give your dashboard a name and click create dashboard
Now you will have an empty monitoring dashboard with no widgets and it will ask you to create your first widget.
Step 2 - Create widgets with Lambda function default metrics
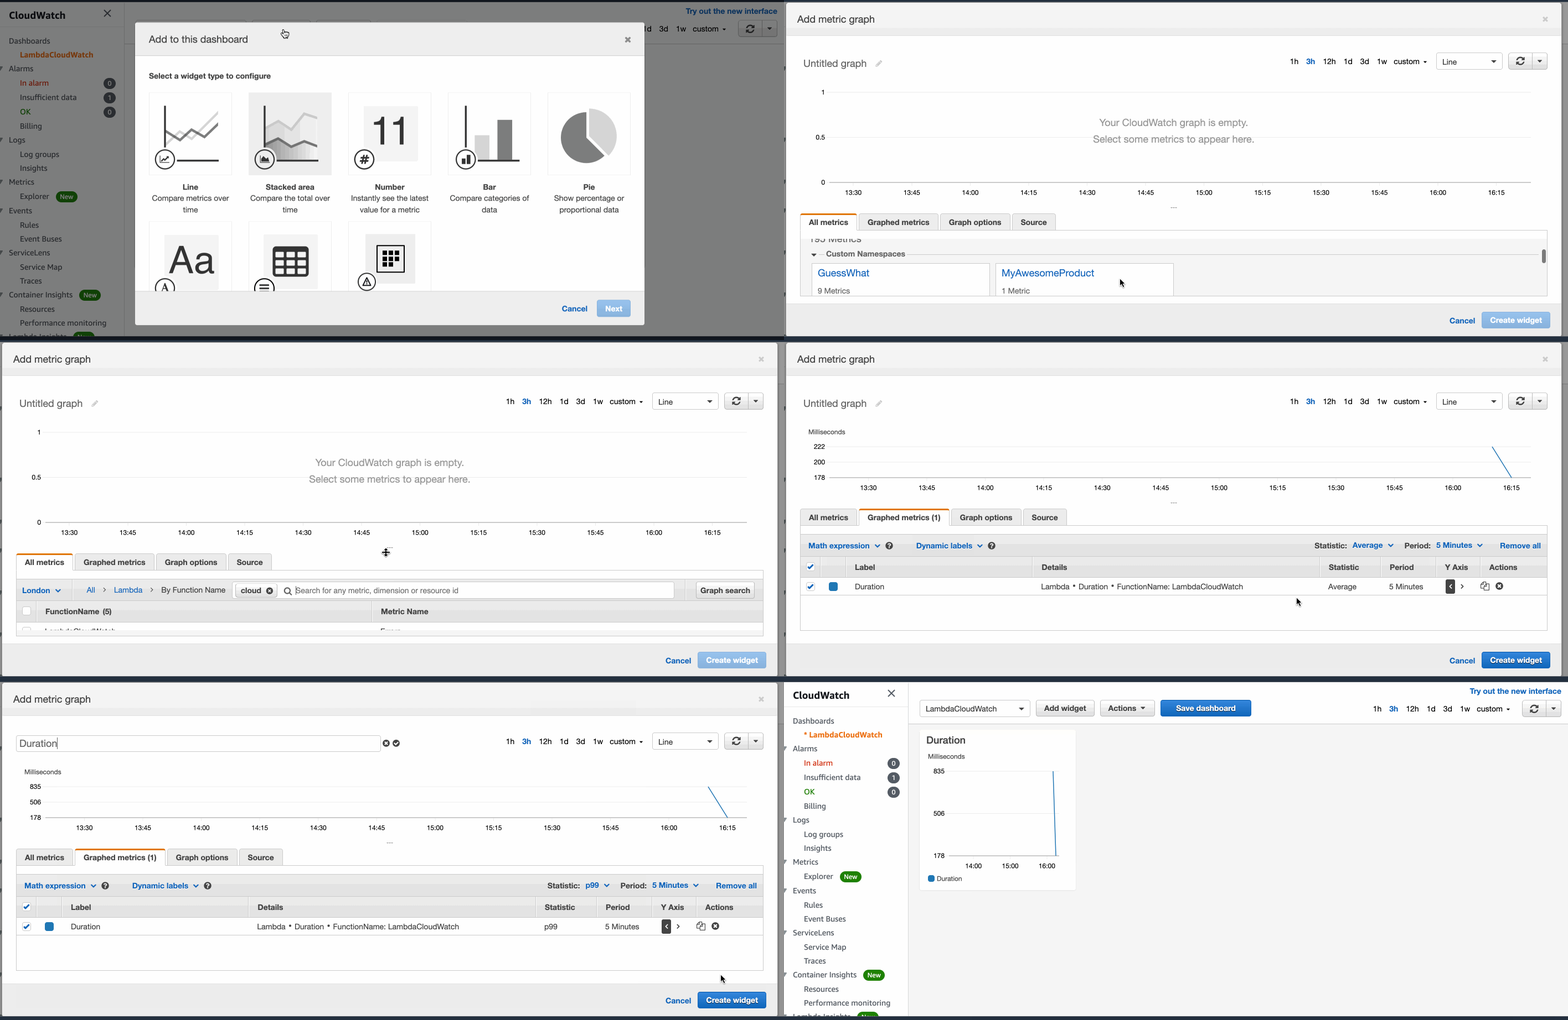
Latency
- Click on add widget
- Select the line metric and click next
- Select metrics as the data source and click configure
- Under all metrics select: Lambda -> by function name
- This will show you a list of all your Lambda functions and the available metrics. Select the duration metric for any Lambda function you want to monitor
- Click the graphed metrics tab and change the statistic to P99
- Click create widget
You might be wondering why we decided to change the statistic from average to P99? The average statistic can be misleading. Let’s look at a collection of latencies: 20, 30, 90, 100, 110, 300, 350, 700, 950. The average is 295. We can see that some requests are faster, but some requests were much slower than 295. These requests represent real users on your product so understanding the slower requests can help you make decisions to optimise performance. You can plot many percentiles onto your widgets to give you a better understanding of performance.

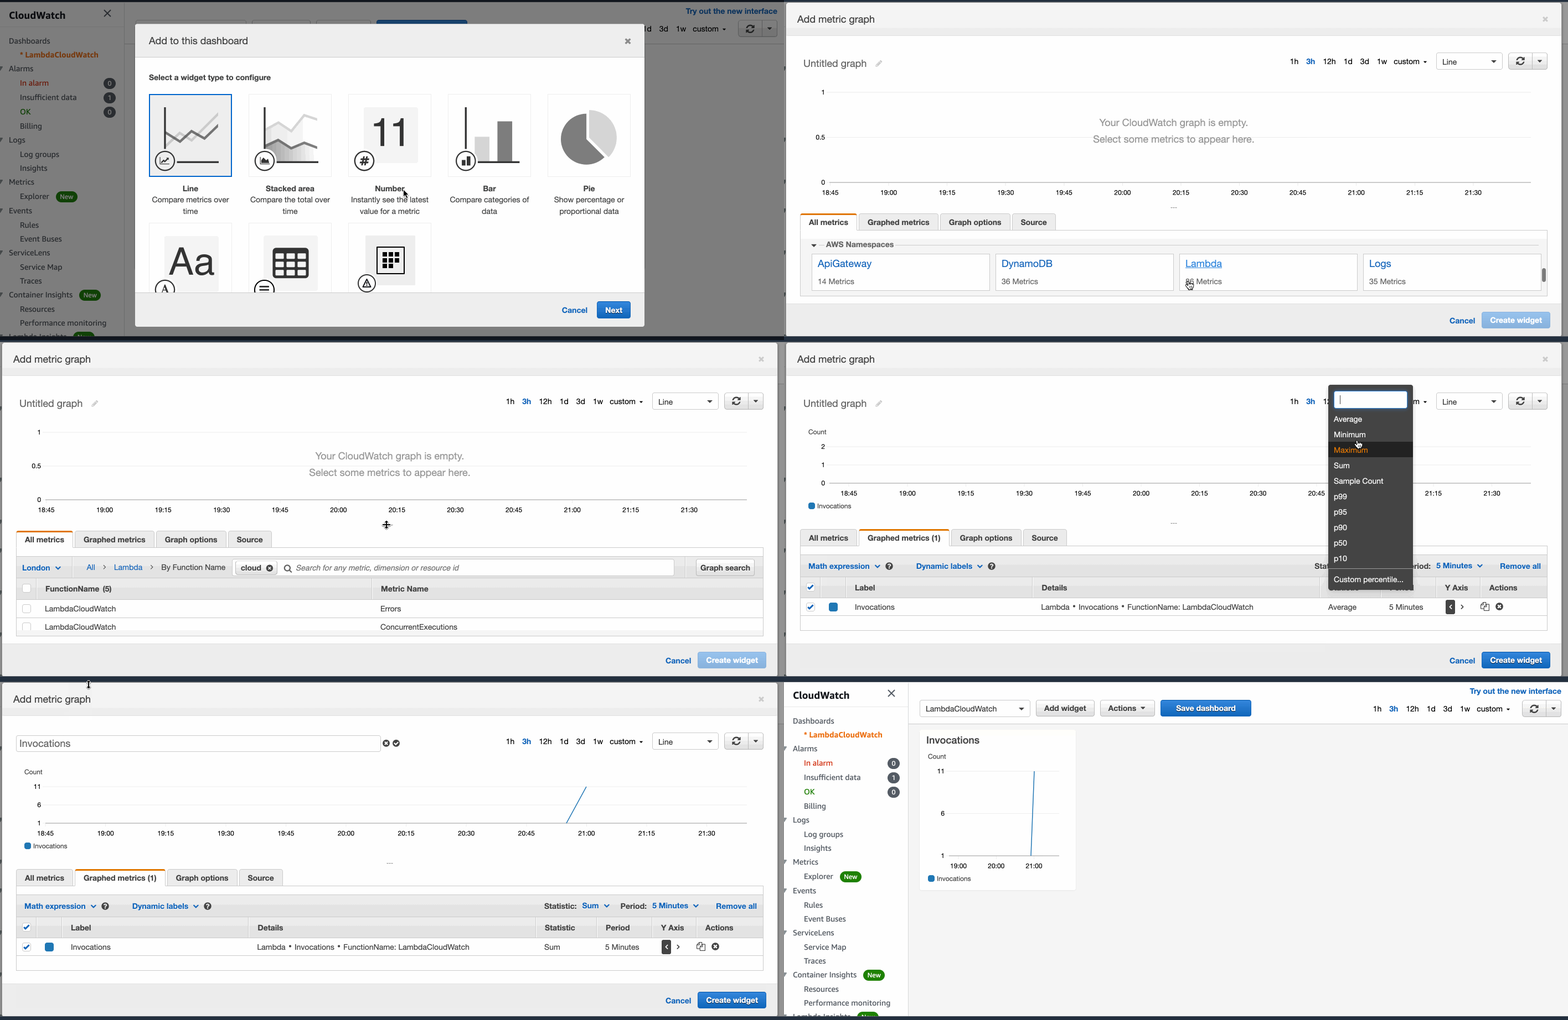
Traffic
- Click on add widget
- Select the line metric and click next
- Select metrics as the data source and click configure
- Under all metrics select: Lambda -> by function name
- This will show you a list of all your Lambda functions and the available metrics. Select the invocation metric for any Lambda function you want to monitor
- Click the graphed metrics tab and change the statistic to sum
- Click create widget

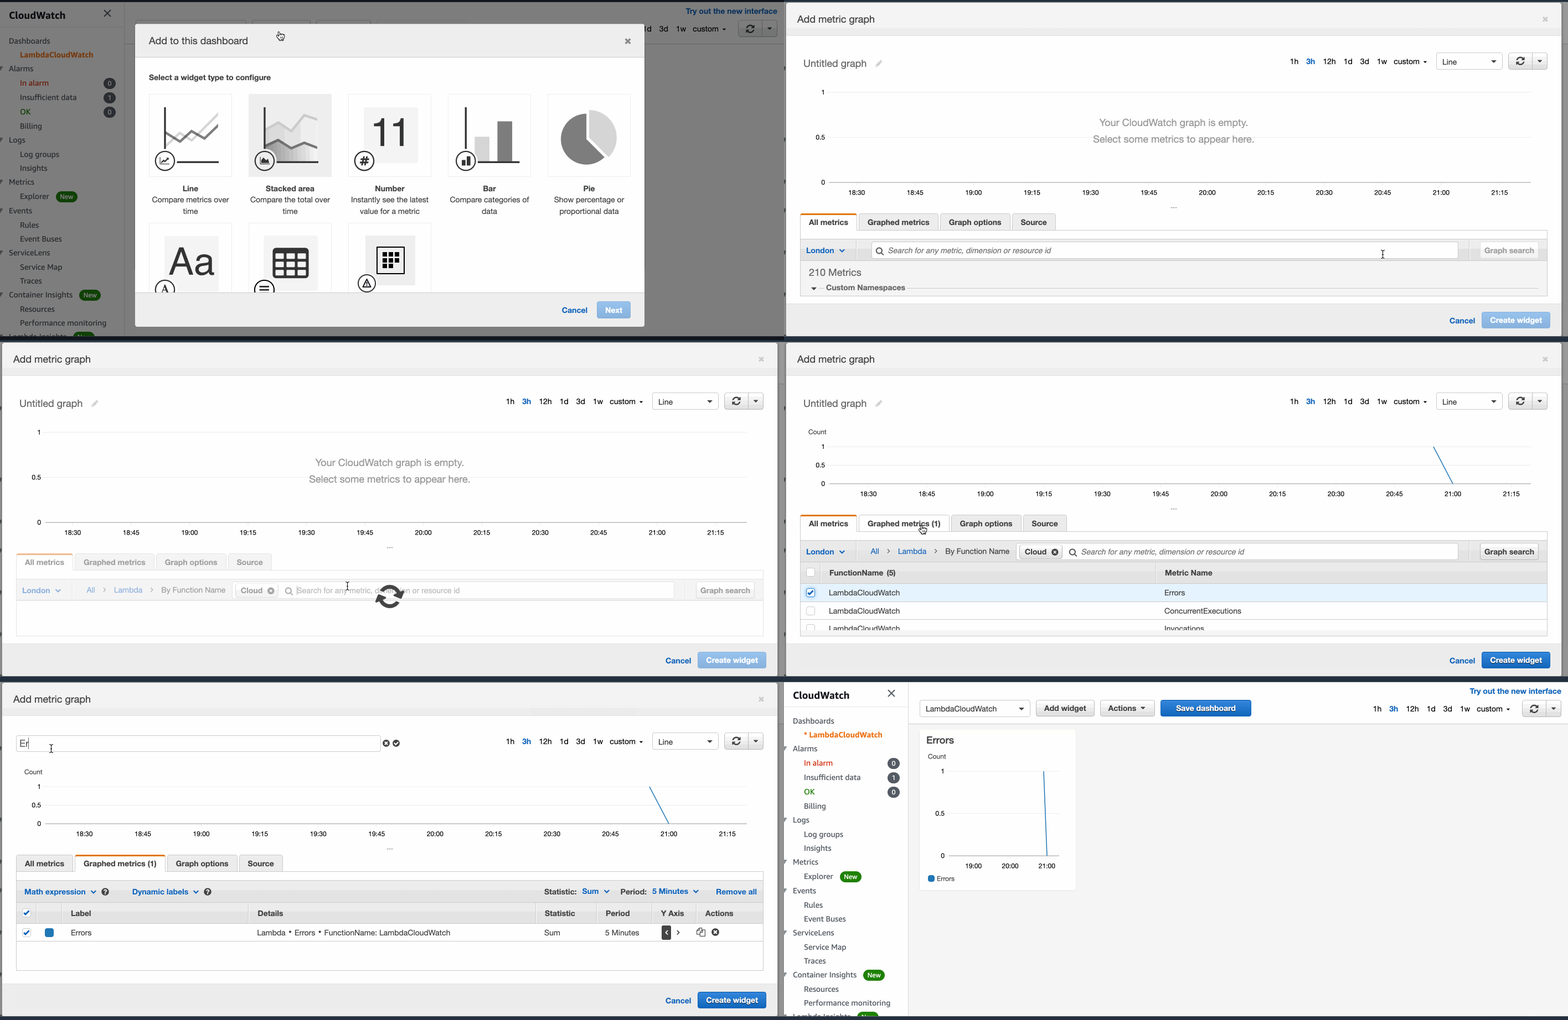
Errors
- Click on add widget
- Select the line metric and click next
- Select metrics as the data source and click configure
- Under all metrics select: Lambda -> by function name
- This will show you a list of all your Lambda functions and the available metrics. Select the errors metric for any Lambda function you want to monitor
- Click the graphed metrics tab and change the statistic to sum
- Click create widget

Step 3 - Create a custom metric from a Lambda function
We will be looking at some simple examples of how to get metrics from a Lambda function into Cloudwatch. What metrics you decide to monitor are up to you and will vary depending on the domain you are working.
Create policy to allow your Lambda function to send metrics
You will need to create a policy to allow your Lambda function to be able to send metrics to Cloudwatch.
The minimum policy you will need is:
{
    "Version": "2012-10-17",
    "Statement": [
        {
            "Action": "cloudwatch:PutMetricData",
            "Resource": "*",
            "Effect": "Allow"
        }
    ]
}
Use Boto3 to send a metric
Firstly lets add Boto3 to your requirements.txt file.
boto3==1.16.37 // Or whatever the latest version is
We can then use Boto3 to send a metric to a custom namespace.
cloudwatch = boto3.client('cloudwatch')
cloudwatch.put_metric_data(
    Namespace='MyAwesomeProduct',
    MetricData=[{
        'MetricName': 'SomeMetricImInterestedIn',
        'Timestamp': datetime.now(),
        'Value': 1,
        'Unit': 'Count',
        'Dimensions': [{
            'Name': 'Action',
            'Value': 'SomethingHappened'
        }]
    }]
)
Lets break this down.
- NameSpace - The metric will be grouped into a namespace that will appear in the custom namespaces section of the metrics tab when you are adding a new widget
- MetricData
- MetricName - The name of the metric. This will be shown in the list of metrics when you are configuring your widget
- Timestamp - This will be the date time associated with the data point. Not required but make it easy for yourself and use UTC. This timestamp can be up to 2 weeks in the past or two hours in the future
- Value - The value for the metric
- Unit - The unit of the value. This is an enum that includes seconds, gigabytes and percent. A full set of units can be found in the documentation
- Dimensions - The dimension makes up the unique identifier for the metric. You can set up to 10.
You can find out more by reading the official Boto3 documentation documentation.
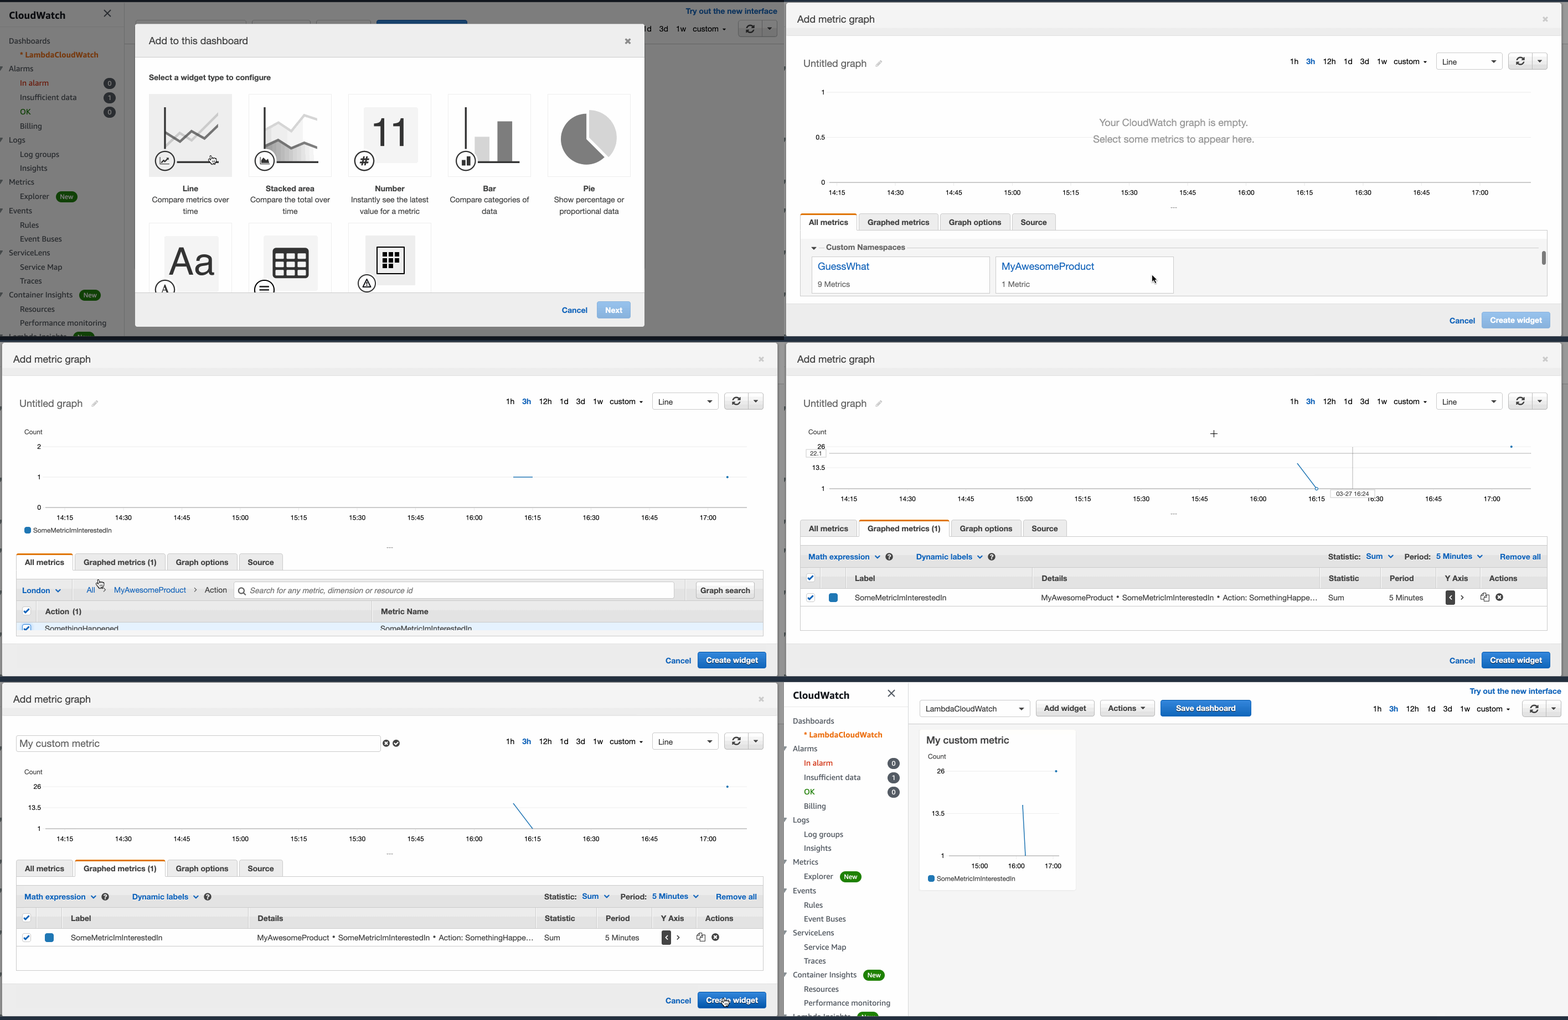
Step 4 - Create a widget for your custom metric
- Click on add widget
- Select the line metric and click next
- Select metrics as the data source and click configure
- Under all metrics you should now see a custom namespace called MyAwesomeProduct
- Click on it and you will see a list of actions where you will see SomethingHappened
- Click on it and you will see the SomeMetricImInterestedIn in the list so go ahead and select it
- Click create widget

There we have it. This was a high level introduction of what we can do with the metrics of our AWS Lambda functions. Thank you for visiting, I hope you found this useful.